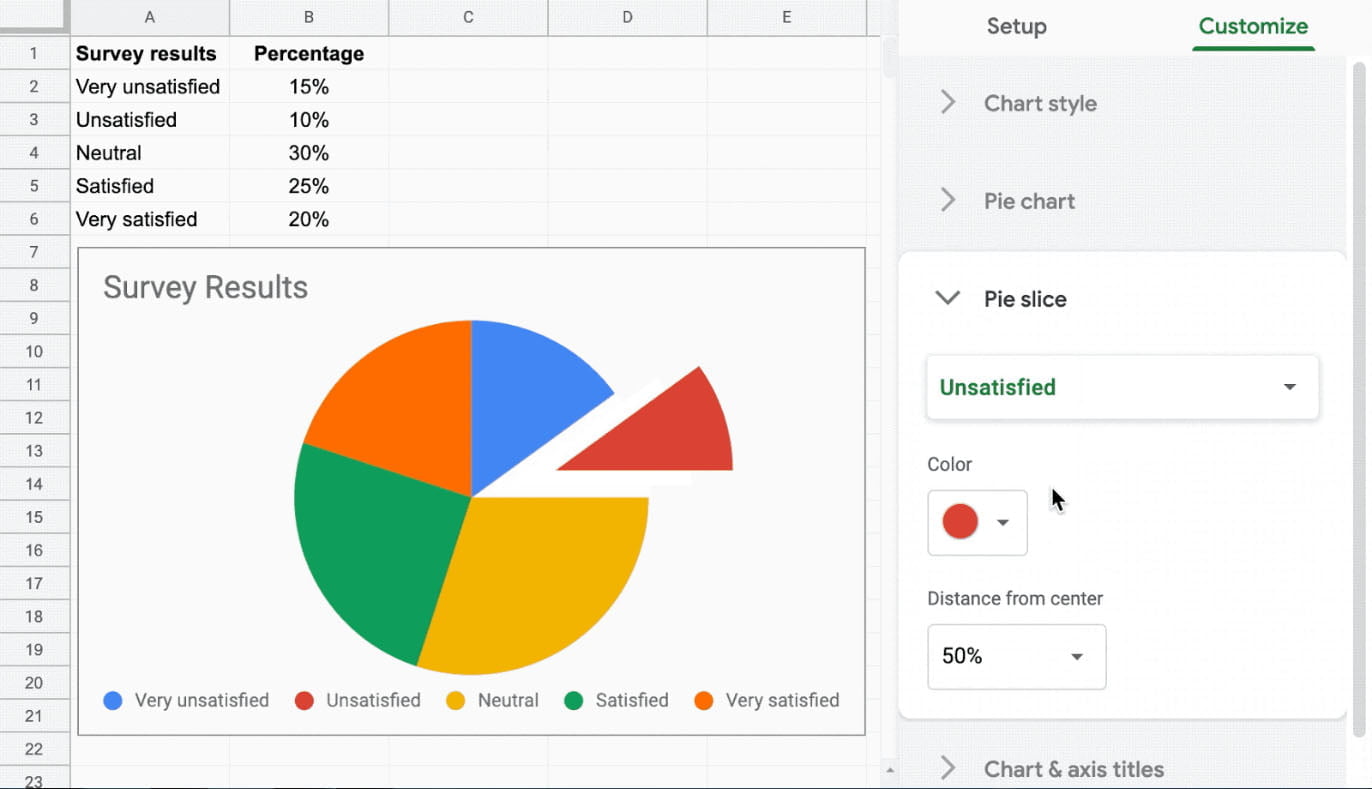
Google Sheets is a powerful spreadsheet tool that allows you to create charts and graphs to visualize your data in a meaningful way. Whether you are working on a project for work or school, creating a chart in Google Sheets is a simple and effective way to present your information. In this blog post, we will guide you through the steps to make a chart in Google Sheets.
Step 1: Enter Your Data
The first step in creating a chart in Google Sheets is to enter your data. You can either type in your data manually or copy and paste it from another source. Make sure your data is organized in columns and rows with labels in the first row and first column.
Step 2: Select Your Data
Once your data is entered, select the range of data that you want to use for your chart. Click and drag your cursor over the cells that contain your data, making sure to include the column and row labels.
Step 3: Insert Your Chart
With your data selected, go to the “Insert” menu at the top of the page and select “Chart.” This will open up the “Chart editor” on the right-hand side of your screen.
Step 4: Choose Your Chart Type
In the “Chart editor,” you can choose from a variety of chart types such as column, bar, line, area, and pie. Select the chart type that best fits your data.
Step 5: Customize Your Chart
After choosing your chart type, you can customize your chart by adding a chart title, axis titles, and adjusting the colors and font. You can also choose to show or hide gridlines and data labels.
Step 6: Save and Share Your Chart
Once your chart is customized to your liking, click “Insert” to add it to your Google Sheets document. You can also save your chart as an image or PDF by clicking the “Download” button in the “Chart editor.” To share your chart with others, simply click the “Share” button in the top right corner of your Google Sheets document.
Conclusion
Creating a chart in Google Sheets is a simple process that can greatly enhance the presentation of your data. By following these six steps, you can easily create a chart that effectively communicates your message. Whether you are using Google Sheets for personal or professional reasons, utilizing the charting tool can help you to better understand your data and make informed decisions.
Zeeshan is a seasoned tech expert and senior writer at Teckrr.com. With over 10 years of experience in tech journalism, he brings insightful analysis and up-to-date information on the latest tech trends. Zeeshan holds a MBA degree from Business and Tech University and is known for his engaging writing style and ability to demystify complex tech topics. Stay connected with the cutting-edge of technology through his expert lens.

Leave a Reply